All the answers you need.
GuidedReflections is the bridge between AI-augmented output and the critical thinkingwe want students to develop. The questions below explain what the feature does,the learning theory behind it, and how it supports academic rigor andinstitutional governance.
1. Whatis Guided Reflections?
GuidedReflections is a new feature now available across our apps. It prompts studentsto reflect on the AI-augmented draft they have produced before they move on torevision. Rather than treating AI output as a finished product, the featureturns it into a starting point for the student's own thinking; the reflectionis where the learning happens.
2. Howdoes Guided Reflections support critical thinking?
The feature isgrounded in the work of two foundational educational theorists. John Deweyargued that we do not learn from experience alone; we learn from reflecting onexperience, a process that turns raw information into genuine understanding(Dewey, 1933). Jack Mezirow extended this through transformative learningtheory, showing that structured, critical reflection is what allows learners toreexamine their assumptions and arrive at deeper, more durable insight(Mezirow, 1991). Guided Reflections operationalizes both ideas. By askingstudents to articulate why they made the choices they made, the feature movesthem from passively accepting AI output to actively interrogating it.
3. Whydoes this matter now?
AI is nowomnipresent in research and writing. The risk is that students hand over theirthinking to a tool and learn nothing in the process. Guided Reflections isdesigned precisely for this moment; it preserves the intellectual work thatmakes a doctoral credential meaningful, while still allowing students tobenefit from AI assistance.
4. Howdoes it work in practice?
After a researchergenerates an AI-augmented draft, the app guides them through a structured setof reflection prompts. When they are finished, they can download two artifacts:the AI-augmented draft and their completed Reflections. These reflections areintended to support the revision process, helping researchers criticallyevaluate the content, make informed edits, and develop a final product thatreflects their own thinking and scholarly voice.
5. Whatdoes the faculty member see?
Faculty receivean auditable trail. Because the AI-augmented draft and the student'sreflections are captured together, faculty reviewers can see not only what thestudent produced but how they engaged with it. This gives faculty a clear,evidence-based view of the student's own contribution rather than guessing atit.
6. Doesthis help with academic integrity and responsible AI use?
Yes. GuidedReflections is a steppingstone toward the responsible use of AI; an integrated,transparent learning workflow rather than a black box. The result is a morevisible and defensible process, one that supports academic rigor, researcherownership, and sound governance infrastructure. For institutions navigating AIpolicy, it provides documentation of how students are actually using thesetools.
7. Willthis slow students down or add friction?
The reflectionstep is integrated directly into the existing workflow, so students stay in oneenvironment. The time students spend reflecting is the time they spendlearning; it is not overhead, it is the point. Most students find thatarticulating their reasoning sharpens their revisions and strengthens the finalproduct.
8. Howdoes this fit into institutional governance?
GuidedReflections produces the kind of transparent, reviewable record that deans,directors, and provosts increasingly need as AI use expands across programs. Itgives institutions a defensible answer to the question of how doctoral studentsare using AI responsibly, backed by artifacts rather than assurances.
9. Howcan I see it in action?
We would beglad to walk you through a brief demonstration tailored to your program. Youcan schedule a time to speak here.
References
Dewey, J. (1933). How we think: A restatement of therelation of reflective thinking to the educative process. D.C. Heath.
Mezirow, J. (1991). Transformative dimensions of adultlearning. Jossey-Bass.
The Importance of Research Questions for Rigorous Gap Analysis
A literature review serves as the bedrock of any robust academic inquiry, laying the groundwork for new investigations by synthesizing existing knowledge. A crucial element of this process is identifying “the gap”—the unaddressed questions, contradictions, or underdeveloped areas within the current body of research that your study aims to fill.
Intellectus Literature Review offers a dedicated “Gap” feature designed to streamline and strengthen this critical step. While the tool excels at automating thematic clustering and drafting synthesized reviews, its ability to build a compelling rationale for your research questions hinges on the precise input of those questions or study aims. By entering your specific research questions into the Intellectus Literature Review app, you empower the tool to:
The imperative is clear: to leverage the full power of Intellectus Literature Review’s “Gap” feature and rigorously justify your study, the explicit entry of well-defined research questions or study aims is essential. This input allows the AI to effectively build the rationale and demonstrate the significance of your investigation within the broader academic landscape.
The Importance of Research Questions for Rigorous Gap Analysis
A literature review serves as the bedrock of any robust academic inquiry, laying the groundwork for new investigations by synthesizing existing knowledge. A crucial element of this process is identifying “the gap”—the unaddressed questions, contradictions, or underdeveloped areas within the current body of research that your study aims to fill.
Intellectus Literature Review offers a dedicated “Gap” feature designed to streamline and strengthen this critical step. While the tool excels at automating thematic clustering and drafting synthesized reviews, its ability to build a compelling rationale for your research questions hinges on the precise input of those questions or study aims. By entering your specific research questions into the Intellectus Literature Review app, you empower the tool to:
– Precisely identify relevant literature: The app can more accurately filter and analyze sources that directly pertain to your specific inquiry.
– Uncover and articulate the research gap: The tool can highlight where existing literature falls short in addressing your stated questions, thus clearly justifying the
need for your study.
– Structure your review’s rationale: By understanding your research questions, the app can help you construct a coherent narrative that directly links existing themes to the rationale for your new research, providing a structured starting point for writing your literature review.
The imperative is clear: to leverage the full power of Intellectus Literature Review’s “Gap” feature and rigorously justify your study, the explicit entry of well-defined research questions or study aims is essential. This input allows the AI to effectively build the rationale and demonstrate the significance of your investigation within the broader academic landscape.
Our services utilize LLMs hosted by third-parties to provide enhanced services, including but not limited to natural language processing, chat support, and content generation. These third-party services may process user data to function effectively. This may include text inputs, user interactions, and other related data necessary for the functionality of the LLM. We do not authorize any customer data to be used by third-party service providers to train LLMs.
Yes, we support the latest versions of Chrome, Firefox, Safari, and Microsoft Edge.
For the statistics and qualitative tools, you can activate a free 7-day trial from within the application. You will need to cancel the trial on or before the 7th day to avoid being charged the monthly subscription fee. The free account for the literature review tool allows for the upload of 5 articles and the creation of one draft. You can upload additional articles/works for $8/upload.
Yes! Intellectus is web-based so it can be used on any operating system. All you need is an internet connection.
We protect your data using industry standard SSL encryption, increasing the security of all data transfers within our application. Once uploaded, your data is stored securely, ensuring your data can only be accessed while logged in to your account. To further enhance the safety and security of your data, we recommend you de-identify your data prior to uploading it.
You can delete all of your data, articles, and drafts from your account. Please be sure to download your drafts prior to deleting.
For the statistics and qualitative tools, you can activate a free 7-day trial from within the application. You will need to cancel the trial on or before the 7th day to avoid being charged the monthly subscription fee. The free account for the literature review tool allows for the upload of 5 articles and the creation of one draft. You can upload additional articles/works for $8/upload.
You can delete all of your data, articles and drafts from your account. Please be sure to download your data, anlayses, and drafts prior to deleting.
GuidedReflections is the bridge between AI-augmented output and the critical thinkingwe want students to develop. The questions below explain what the feature does,the learning theory behind it, and how it supports academic rigor andinstitutional governance.
1. Whatis Guided Reflections?
GuidedReflections is a new feature now available across our apps. It prompts studentsto reflect on the AI-augmented draft they have produced before they move on torevision. Rather than treating AI output as a finished product, the featureturns it into a starting point for the student's own thinking; the reflectionis where the learning happens.
2. Howdoes Guided Reflections support critical thinking?
The feature isgrounded in the work of two foundational educational theorists. John Deweyargued that we do not learn from experience alone; we learn from reflecting onexperience, a process that turns raw information into genuine understanding(Dewey, 1933). Jack Mezirow extended this through transformative learningtheory, showing that structured, critical reflection is what allows learners toreexamine their assumptions and arrive at deeper, more durable insight(Mezirow, 1991). Guided Reflections operationalizes both ideas. By askingstudents to articulate why they made the choices they made, the feature movesthem from passively accepting AI output to actively interrogating it.
3. Whydoes this matter now?
AI is nowomnipresent in research and writing. The risk is that students hand over theirthinking to a tool and learn nothing in the process. Guided Reflections isdesigned precisely for this moment; it preserves the intellectual work thatmakes a doctoral credential meaningful, while still allowing students tobenefit from AI assistance.
4. Howdoes it work in practice?
After a researchergenerates an AI-augmented draft, the app guides them through a structured setof reflection prompts. When they are finished, they can download two artifacts:the AI-augmented draft and their completed Reflections. These reflections areintended to support the revision process, helping researchers criticallyevaluate the content, make informed edits, and develop a final product thatreflects their own thinking and scholarly voice.
5. Whatdoes the faculty member see?
Faculty receivean auditable trail. Because the AI-augmented draft and the student'sreflections are captured together, faculty reviewers can see not only what thestudent produced but how they engaged with it. This gives faculty a clear,evidence-based view of the student's own contribution rather than guessing atit.
6. Doesthis help with academic integrity and responsible AI use?
Yes. GuidedReflections is a steppingstone toward the responsible use of AI; an integrated,transparent learning workflow rather than a black box. The result is a morevisible and defensible process, one that supports academic rigor, researcherownership, and sound governance infrastructure. For institutions navigating AIpolicy, it provides documentation of how students are actually using thesetools.
7. Willthis slow students down or add friction?
The reflectionstep is integrated directly into the existing workflow, so students stay in oneenvironment. The time students spend reflecting is the time they spendlearning; it is not overhead, it is the point. Most students find thatarticulating their reasoning sharpens their revisions and strengthens the finalproduct.
8. Howdoes this fit into institutional governance?
GuidedReflections produces the kind of transparent, reviewable record that deans,directors, and provosts increasingly need as AI use expands across programs. Itgives institutions a defensible answer to the question of how doctoral studentsare using AI responsibly, backed by artifacts rather than assurances.
9. Howcan I see it in action?
We would beglad to walk you through a brief demonstration tailored to your program. Youcan schedule a time to speak here.
References
Dewey, J. (1933). How we think: A restatement of therelation of reflective thinking to the educative process. D.C. Heath.
Mezirow, J. (1991). Transformative dimensions of adultlearning. Jossey-Bass.
Our services utilize LLMs hosted by third-parties to provide enhanced services, including but not limited to natural language processing, chat support, and content generation. These third-party services may process user data to function effectively. This may include text inputs, user interactions, and other related data necessary for the functionality of the LLM. We do not authorize any customer data to be used by third-party service providers to train LLMs.
We protect your data using industry standard SSL encryption, increasing the security of all data transfers within our application. Once uploaded, your data is stored securely, ensuring your data can only be accessed while logged in to your account. To further enhance the safety and security of your data, we recommend you de-identify your data prior to uploading it.
Yes, we support the latest versions of Chrome, Firefox, Safari, and Microsoft Edge.
All the answers you need.
The Importance of Research Questions for Rigorous Gap Analysis
A literature review serves as the bedrock of any robust academic inquiry, laying the groundwork for new investigations by synthesizing existing knowledge. A crucial element of this process is identifying “the gap”—the unaddressed questions, contradictions, or underdeveloped areas within the current body of research that your study aims to fill.
Intellectus Literature Review offers a dedicated “Gap” feature designed to streamline and strengthen this critical step. While the tool excels at automating thematic clustering and drafting synthesized reviews, its ability to build a compelling rationale for your research questions hinges on the precise input of those questions or study aims. By entering your specific research questions into the Intellectus Literature Review app, you empower the tool to:
The imperative is clear: to leverage the full power of Intellectus Literature Review’s “Gap” feature and rigorously justify your study, the explicit entry of well-defined research questions or study aims is essential. This input allows the AI to effectively build the rationale and demonstrate the significance of your investigation within the broader academic landscape.
The free account allows for the upload of 5 articles and the creation of one draft. You can upload additional articles/works for $8/upload.
Yes! Intellectus is web-based so it can be used on any operating system. All you need is an internet connection.
You can delete all of your articles and drafts from your account. Please be sure to download your drafts prior to deleting.
The application will accept articles and sources in .pdf, .html, .docx, and .txt formats.
A literature review serves as the bedrock of any robust academic inquiry, laying the
groundwork for new investigations by synthesizing existing knowledge. A crucial
element of this process is identifying “the gap”—the unaddressed questions,
contradictions, or underdeveloped areas within the current body of research that your
study aims to fill.
Intellectus Literature Review offers a dedicated “Gap” feature designed to streamline
and strengthen this critical step. While the tool excels at automating thematic clustering
and drafting synthesized reviews, its ability to build a compelling rationale for your
research questions hinges on the precise input of those questions or study aims. By
entering your specific research questions into the Intellectus Literature Review app, you
empower the tool to:
– Precisely identify relevant literature: The app can more accurately filter and
analyze sources that directly pertain to your specific inquiry.
– Uncover and articulate the research gap: The tool can highlight where existing
literature falls short in addressing your stated questions, thus clearly justifying the
need for your study.
– Structure your review’s rationale: By understanding your research questions,
the app can help you construct a coherent narrative that directly links existing
themes to the rationale for your new research, providing a structured starting
point for writing your literature review.
The imperative is clear: to leverage the full power of Intellectus Literature Review’s
“Gap” feature and rigorously justify your study, the explicit entry of well-defined research
questions or study aims is essential. This input allows the AI to effectively build the
rationale and demonstrate the significance of your investigation within the broader
academic landscape.
The free account allows for the upload of 5 articles and the creation of one draft. You can upload additional articles/works for $8/upload.
You can delete all of your articles and drafts from your account. Please be sure to download your drafts prior to deleting.
The Importance of Research Questions for Rigorous Gap Analysis
A literature review serves as the bedrock of any robust academic inquiry, laying the groundwork for new investigations by synthesizing existing knowledge. A crucial element of this process is identifying “the gap”—the unaddressed questions, contradictions, or underdeveloped areas within the current body of research that your study aims to fill.
Intellectus Literature Review offers a dedicated “Gap” feature designed to streamline and strengthen this critical step. While the tool excels at automating thematic clustering and drafting synthesized reviews, its ability to build a compelling rationale for your research questions hinges on the precise input of those questions or study aims. By entering your specific research questions into the Intellectus Literature Review app, you empower the tool to:
The imperative is clear: to leverage the full power of Intellectus Literature Review’s “Gap” feature and rigorously justify your study, the explicit entry of well-defined research questions or study aims is essential. This input allows the AI to effectively build the rationale and demonstrate the significance of your investigation within the broader academic landscape.
A literature review serves as the bedrock of any robust academic inquiry, laying the
groundwork for new investigations by synthesizing existing knowledge. A crucial
element of this process is identifying “the gap”—the unaddressed questions,
contradictions, or underdeveloped areas within the current body of research that your
study aims to fill.
Intellectus Literature Review offers a dedicated “Gap” feature designed to streamline
and strengthen this critical step. While the tool excels at automating thematic clustering
and drafting synthesized reviews, its ability to build a compelling rationale for your
research questions hinges on the precise input of those questions or study aims. By
entering your specific research questions into the Intellectus Literature Review app, you
empower the tool to:
– Precisely identify relevant literature: The app can more accurately filter and
analyze sources that directly pertain to your specific inquiry.
– Uncover and articulate the research gap: The tool can highlight where existing
literature falls short in addressing your stated questions, thus clearly justifying the
need for your study.
– Structure your review’s rationale: By understanding your research questions,
the app can help you construct a coherent narrative that directly links existing
themes to the rationale for your new research, providing a structured starting
point for writing your literature review.
The imperative is clear: to leverage the full power of Intellectus Literature Review’s
“Gap” feature and rigorously justify your study, the explicit entry of well-defined research
questions or study aims is essential. This input allows the AI to effectively build the
rationale and demonstrate the significance of your investigation within the broader
academic landscape.
The application will accept articles and sources in .pdf, .html, .docx, and .txt formats.
All the answers you need.
Evidence-Based Practice (EBP) is a systematic approach to clinical decision-making that integrates the best available research evidence with clinical expertise and patient values/preferences. It involves five key steps: formulating clinical questions, searching for the best evidence, critically appraising that evidence, integrating it with clinical expertise and patient preferences, and evaluating the outcomes.
Quality Improvement (QI) is a systematic, data-driven approach to enhancing healthcare processes, outcomes, and patient experiences. It focuses on identifying problems, implementing changes, measuring results, and sustaining improvements through continuous cycles of assessment and refinement.
Key Distinctions
EBP primarily focuses on integrating research findings into individual clinical decisions and practice standards.
QI takes a broader systems approach, examining workflows, processes, and organizational structures to drive improvement.
Within Magnet Hospitals
Magnet-designated hospitals have particularly distinctive approaches to both concepts.
Enhanced EBP Integration: Magnet hospitals are required to demonstrate robust EBP programs with dedicated resources and infrastructure. They must show evidence of nurses leading research initiatives and translating findings into practice. There’s an expectation for shared governance structures that empower bedside nurses to implement evidence-based changes.
Elevated QI Expectations: Magnet hospitals must demonstrate superior patient outcomes through systematic QI efforts. They’re required to show sustained improvements over time, not just isolated projects. There’s emphasis on nurse-led QI initiatives and interdisciplinary collaboration.
Synergistic Approach: In Magnet hospitals, EBP and QI are often more integrated than in non-Magnet facilities. Nurses are expected to use evidence-based approaches within their QI projects, and QI data frequently drives new EBP initiatives. This creates a culture where research, practice, and improvement efforts are seamlessly connected, with nurses empowered to lead changes that improve patient outcomes.
Please reference our IRB Compliance document to assist you in filling out IRB forms. You can view the document here.
1. Text embeddings are generated for the open-ended responses using an AI embeddings model.
2. A k-means cluster analysis is conducted on the responses.
3. The k-means model is used to obtain a random sample of open-ended responses from each cluster.
4. A category name is generated for each sample using a generative AI model.
5. The k-means categories are replaced with the new category names and added to the dataset.
It’s also important to emphasize that you should review and validate the category names (and associations with open-ended responses) since an AI model cannot be held responsible for its work.
The adoption of data analysis tools in research and education is a complex process that often begins with individual faculty members. In the case of Intellectus, a data analysis tool that has been gaining popularity among individual faculty members for its utility and cost-effectiveness, the process of adoption starts with individual faculty members who have experienced the benefits of the tool and introduce it to other faculty and department directors for departmental consideration. This step in the adoption process can lead to the adoption of Intellectus at one or multiple matriculation levels, such as DNP, PhD, masters, or undergraduate programs.
As the adoption of Intellectus expands within a department, it often catches the attention of college deans who see the broader potential application of the tool to other departments within their college. This leads to a deeper understanding of the tool’s capabilities and a wider dissemination of its benefits.
College deans may also collaborate with deans from other colleges to explore the benefits of Intellectus. This can lead to the adoption of Intellectus at the institutional level, as Chief Academic Officers and Vice Provosts recognize the utility of the tool for students, faculty, staff, and administrators.
Finally, the adoption of Intellectus can also extend to the system level, as several institutions within a system adopt the tool and the Chancellor’s office sees the potential for system level integration and cost savings.
This case study highlights the roadmap of the adoption of Intellectus from individual to institution, highlighting the key steps and actors involved in the process.
The maximum upload size is 100MB. The number of rows and columns can vary based on the number of numeric variables and the number of levels within nominal variables.
Yes, they can be requested by emailing Support@IntellectusStatistics.com.
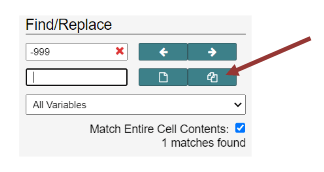
Intellectus uses blanks for all missing data. If your data set has -999, -1, NA, or other values or symbols to indicate missing data, go to the Management tab, Click Edit data, then Find/Replace. Enter missing data symbol or number in Find/Replace, add a blank space in the Replace, and click “Match entire cell contents,” then click the “Replace All” icon indicated by the red arrow below.
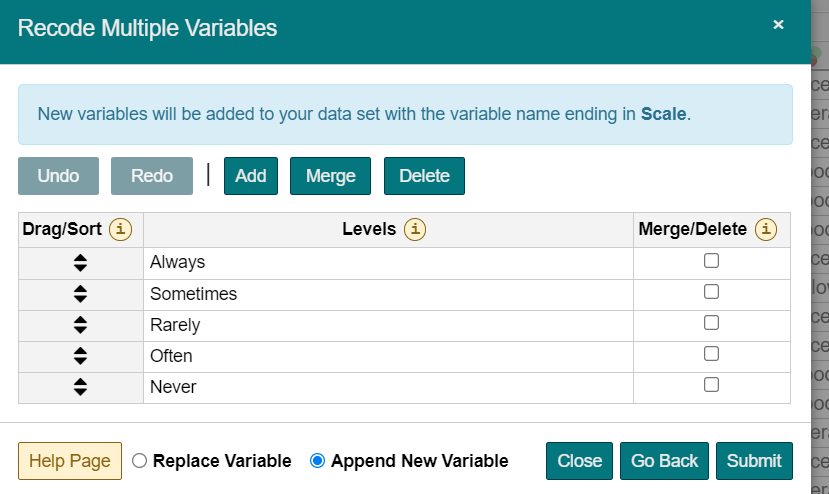
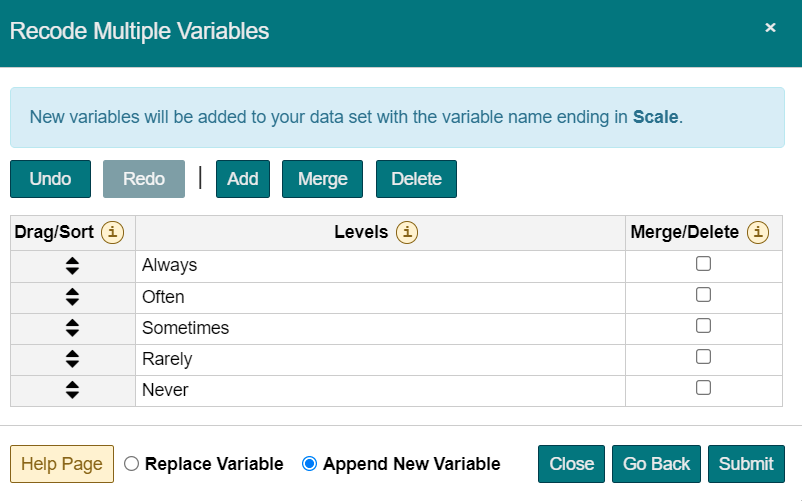
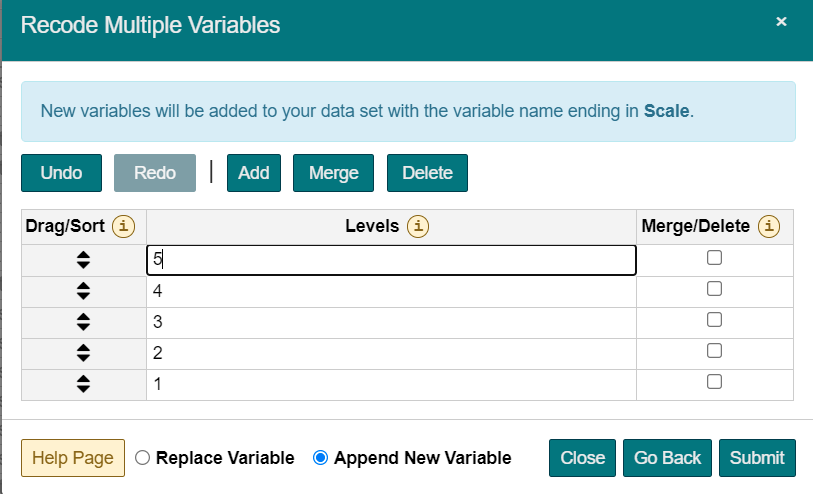
This is likely a level of measurement or number of levels issue. For example, a scale variable for a t-test is coded as ordinal, or you need a nominal variable with two levels and it has three (Male, Men, Female). For either issue, go to Management tab, then click the down-carrot under the variable name, then click select either the correct level of measurement needed or Manage. In Manage, ensure the levels are accurate by Merging or Deleting unnecessary levels.
Intellectus is the premier tool to learn about statistical analyses as faculty don’t waste time “teaching the tool” and students have numerous opportunities to learn how to interpret and write results with the AutoDrafting technology, and ample practice on “raw output” through example datasets, Intellectus’ Statistics Course, and test bank. In our view, the time to learn and think about statistics, and how to write, is not in the dissertation process, but rather in their statistics course. The statistics course, done well, will prepare them to independently write their quantitative dissertation (saving the faculty mentor about 4-5 hours/student). Moreover, in the dissertation process, students use the tool and AutoDrafting to streamline their results chapter draft and to put into their own voice. We’ve published all output with Turn-it-in to dissuade students from just pasting. The process of learning is in their statistics class and the time to accurately and rigorously draft results is in the dissertation process.
Here’s the procedure to recode multiple variable(s):
A 7-day free trial is available to all users. You must enter your credit card information to begin the trial, but you will not be charged until the trial period is over.
If you do not cancel your free trial, it will be converted into a regular subscription after 7-days and you will be billed at the beginning of each billing period. At any point, you may cancel your subscription to avoid being charged for the following billing period.
Yes, we provide one-on-one consulting. You an register for a session within the application by clicking the Consulting Session tab located at the bottom of the left menu.
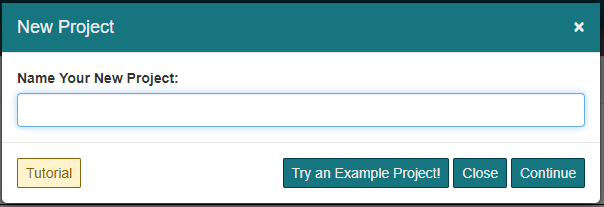
To create a Project, first . You can create a new Project by clicking the button at the top of the Projects panel.

The next step is to choose a name for your project. Type the desired name into the text box and click Continue.
Now you must choose a data source. If uploading a file, click the icon corresponding to the correct format, otherwise click the icon to enter data manually. Currently supported file formats include the following:
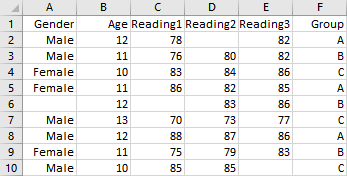
Make sure your dataset is organized into columns with the variable names at the top. In an Excel or CSV file, your variable names will appear on row 1. If you are entering data manually, the variable names are entered above row 1.
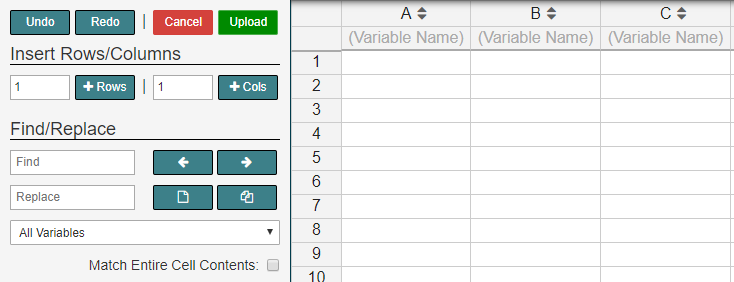
If you don’t have a file, you can upload data by entering the data from scratch in our data editor. The top row of the data editor should contain the variable names and the rows labelled 1,2,3, … should contain the data for the variables. After you are finished entering your data in the spreadsheet, click the Upload button. In order to find out more information about the Data Editor’s sidebar go to the edit data help page.
The decision tree is designed to help you choose which analysis is best for how you want to analyze your data. To use the decision tree, all you have to do is choose the best option that best answers the question or statement. Continue to answer the questions until an analysis is selected that meets the criteria you provided. As you answer questions, you will see the decision tree being highlighted, so you can see the decisions being made and see its path.
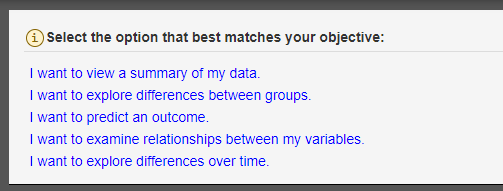
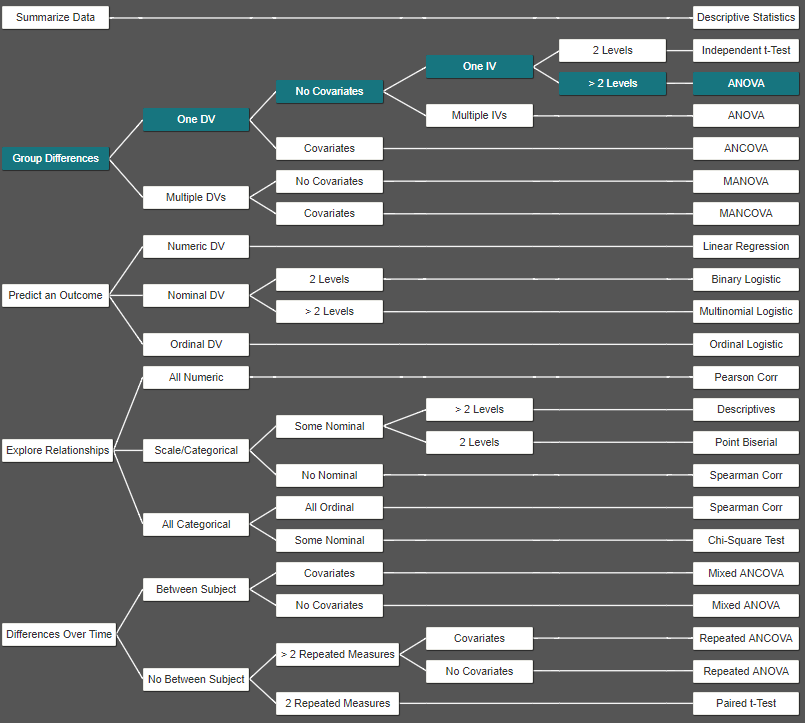
After the decision selects an analysis, you can click the Conduct Analysis link. If you have your project already selected, then the analysis modal will come up for you to provide the inputs and add the analysis to your document in the analysis tab. If there is no project selected, then a dialog will notify you saying that a project must be selected first.
Intellectus provides scatterplots, bubble plots, histograms, line plots, profile plots, bar plots, pie charts, box plots, and pareto charts. Intellectus also offers a range of control charts, including I, MR, X-bar R, X-bar S, R, S U, C, P and NP Charts. Within many of these control charts are seven rulesets: AIAG, IHI, Montgomery, Nelson-Juran, Joint Commission, Western Electric, and Westgard. Autodrafting technology automatically interprets these rulesets.
Go to Analyses tab, conduct Descriptives for the variable, then under Output Format, select Raw Output. This is the raw output view that presents quantiles for 10%, 20%, 25%, 30%, 40%, 50%, 60%, 70%, 75%, 80%, and 90% of that variable.
Data can be structured in many ways, depending on which analysis is conducted. Intellectus has numerous examples of how to arrange data. Go to Projects tab, select Create Project/ Upload Dataset, then select Choose an Example Dataset. Then select the dataset from Suggested Analysis for the analysis you want to conduct, look at the variables for that analysis, and mirror that data format.
Current APA guidelines require that you cite software used as part of a research study. To adhere to these guidelines, please use the following citation when utilizing Intellectus Statistics™ in your research:
Intellectus Statistics. (2026). Intellectus Statistics [Online computer software]. Retrieved from http://statistics.intellectus360.com
Intellectus Statistics has been designed to allow you to perform data management tasks while utilizing the software. After you first upload your data, you can verify the Level of Measurement for each of your variables, and can change the level by selecting the desired option from the appropriate drop down menu and following the subsequent instructions. The Manage Your Data page also allows you to perform further management tasks, including Reverse Coding, Computation of Composite Scores, Removal of Univariate Outliers, Removal of Multivariate Outliers, Transformation, and Multiple Imputation. To learn more about each of these options, simply scroll over the desired task and a pop-up window will provide more information. After you have performed your data management tasks, you have the option to download an updated data set that will reflect any changes you made.
No, Intellectus Statistics is a stand-alone platform. You do not need to have access to SPSS, SAS, STATA or any other analysis program to use Intellectus Statistics™.
Yes! Intellectus is web-based so it can be used on any operating system. All you need is an internet connection.
Intellectus Statistics uses two methods of imputation, both described in the book Data Analysis Using Regression and Multilevel/Hierarchical Models by Andrew Gelman and Jennifer Hill. For Nominal and Ordinal variables, the missing values are imputed by randomly sampling from the observed categories. For Scale variables, a type of regression imputation is used. First, the missing values are imputed using the predicted values from the regression (the mean in this case). Last, a random amount is added to each imputed value based on the prediction error.
The data view in Data Tools only shows the first 500 observations. To view and manage the entire data set, click Edit Data option under Data Tools.
Select Create Project/Upload Dataset
Name your project
Select the type of data that you would like to upload
Upload your dataset from your device.
A usability study was published in 2018 comparing Intellectus Statistics and SPSS differences in user performance based on presentation of statistical data. You can read the full study here.
Once logged-in to the application, click the Profile option located at the top right. Select “Account” and from that screen click the “cancel” option next to the subscription you’d like to cancel.
When your data is uploaded to the Intellectus Statistics application you should confirm your levels of measurement are as follows for each analysis:
Pearson Correlation: All variables are scale level of measurement
One way ANOVA: Independent variable is nominal level of measurement; dependent variable is scale
Independent samples t-test: Independent variable is a dichotomous nominal; dependent variable is scale
Dependent samples t-test: both variables are scale
Chi-square: x variable (factor) is nominal; Y variable (factor) is nominal
Linear regression: Dependent variable is scale; predictor(s) scale, ordinal, or nominal
Mediation: Continuous or dichotomous categorical variable
Moderation: Continuous or dichotomous categorical variable
Reliability: All variables should be the same level of measurement with themselves (e.g., only ordinal variables used together)
Logistic regression: Independent variables are nominal or scale; dependent variable is dichotomous
Wilcoxon signed rank: Both variables are ordinal (or scale)
Mann Whitney U: Independent variable is dichotomous; dependent variable is ordinal (or scale)
Kruskal Wallis: Independent variable is nominal with three or more levels; dependent variable is ordinal (or scale)
Friedman Test: All variables are ordinal (or scale)
Repeated measures ANOVA: All variables are scale
One-within One between ANOVA: Independent variable is nominal; dependent variables are scale
ANCOVA: Independent variable is nominal; covariates are scale; dependent variable is scale
Two-Between ANOVA: Dependent variable is scale; independent variables are nominal
The application will accept data in CSV, Excell, SPSS, SAS, and STATA formats, you can also enter your own data.
When uploading your data file to the application all variables with text data will default to nominal level of measurement and all variables with numeric data will default to scale level of measurement. Level of measurement can be adjusted after upload if desired.
Nominal: In this level of measurement, alphanumeric characters or names are used to categorize the data. For example, if gender is your variable, the responses will be male or female.
Ordinal: Ordinal level variables have a meaningful order to them such as rank. For example there is an order to “drink size” (small, medium, large, extra large), however there is not a consistent interval (volume, distance, time, etc.) among categories.
Scale: Numeric variables that have equal intervals between each value, for example age. For example, the amount of time between a 1 year old and 2 year old is the same amount of time as a 51 and 52 year old.
Absolutely yes. The Intellectus Statistics statistical tests (e.g., ANOVA, regression, chi-square, etc.) use the same statistical algorithms (e.g., least squares) and probability distributions (e.g., binominal, chi-squared, F-distribution, Fisher’s Z, Logistic, Normal, Poisson, etc.). Therefore, the significance levels and conclusions drawn are precisely the same and yield identical results.
Intellectus does not support uploading data spread out over multiple tabs in Excel. In order to have all your data upload, you will need to combine it all onto the first tab. There are two ways to do this depending on whether you have matched case data or independent samples.
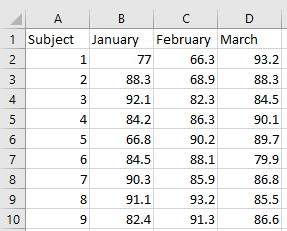
Matched-case data is when you have data for the same subjects in each group. Each observation will have a “Subject ID” that you could use to match rows across multiple samples. Combining matched-case data involves pasting the columns side-by-side and matching them by ID. Let’s say we have matched-case data for each month on a new tab. We can copy the columns of each tab and match up the “Subject IDs” and paste them in the data on the first tab. The end result will look something like this:
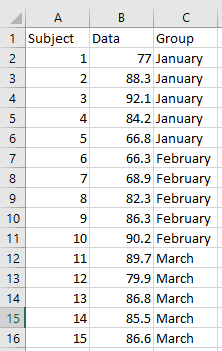
If you have independent samples, where each observation is a different subject, you will need to create a grouping variable instead. Let’s go with the same example above, so we have some measurement by month, where each tab is a different month on independent samples.
While students are taught four levels of measurement (Nominal, Ordinal, Interval, and Ratio), Intellectus Statistics groups Interval and Ratio data into a single category called Scale. This is a standard practice in statistical software because the mathematical tests used for Interval data (like a personality score) are the same as those used for Ratio data (like weight or height).
Understanding the "Scale" Umbrella
In your classroom, you likely teach the nuances between the four levels:
In Intellectus Statistics:
Evidence-Based Practice (EBP) is a systematic approach to clinical decision-making that integrates the best available research evidence with clinical expertise and patient values/preferences. It involves five key steps: formulating clinical questions, searching for the best evidence, critically appraising that evidence, integrating it with clinical expertise and patient preferences, and evaluating the outcomes.
Quality Improvement (QI) is a systematic, data-driven approach to enhancing healthcare processes, outcomes, and patient experiences. It focuses on identifying problems, implementing changes, measuring results, and sustaining improvements through continuous cycles of assessment and refinement.
Key Distinctions
EBP primarily focuses on integrating research findings into individual clinical decisions and practice standards.
QI takes a broader systems approach, examining workflows, processes, and organizational structures to drive improvement.
Within Magnet Hospitals
Magnet-designated hospitals have particularly distinctive approaches to both concepts.
Enhanced EBP Integration: Magnet hospitals are required to demonstrate robust EBP programs with dedicated resources and infrastructure. They must show evidence of nurses leading research initiatives and translating findings into practice. There’s an expectation for shared governance structures that empower bedside nurses to implement evidence-based changes.
Elevated QI Expectations: Magnet hospitals must demonstrate superior patient outcomes through systematic QI efforts. They’re required to show sustained improvements over time, not just isolated projects. There’s emphasis on nurse-led QI initiatives and interdisciplinary collaboration.
Synergistic Approach: In Magnet hospitals, EBP and QI are often more integrated than in non-Magnet facilities. Nurses are expected to use evidence-based approaches within their QI projects, and QI data frequently drives new EBP initiatives. This creates a culture where research, practice, and improvement efforts are seamlessly connected, with nurses empowered to lead changes that improve patient outcomes.
Please reference our IRB Compliance document to assist you in filling out IRB forms. You can view the document here.
The adoption of data analysis tools in research and education is a complex process that often begins with individual faculty members. In the case of Intellectus, a data analysis tool that has been gaining popularity among individual faculty members for its utility and cost-effectiveness, the process of adoption starts with individual faculty members who have experienced the benefits of the tool and introduce it to other faculty and department directors for departmental consideration. This step in the adoption process can lead to the adoption of Intellectus at one or multiple matriculation levels, such as DNP, PhD, masters, or undergraduate programs.
As the adoption of Intellectus expands within a department, it often catches the attention of college deans who see the broader potential application of the tool to other departments within their college. This leads to a deeper understanding of the tool’s capabilities and a wider dissemination of its benefits.
College deans may also collaborate with deans from other colleges to explore the benefits of Intellectus. This can lead to the adoption of Intellectus at the institutional level, as Chief Academic Officers and Vice Provosts recognize the utility of the tool for students, faculty, staff, and administrators.
Finally, the adoption of Intellectus can also extend to the system level, as several institutions within a system adopt the tool and the Chancellor’s office sees the potential for system level integration and cost savings.
This case study highlights the roadmap of the adoption of Intellectus from individual to institution, highlighting the key steps and actors involved in the process.
Yes, they can be requested by emailing Support@IntellectusStatistics.com.
Intellectus is the premier tool to learn about statistical analyses as faculty don’t waste time “teaching the tool” and students have numerous opportunities to learn how to interpret and write results with the AutoDrafting technology, and ample practice on “raw output” through example datasets, Intellectus’ Statistics Course, and test bank. In our view, the time to learn and think about statistics, and how to write, is not in the dissertation process, but rather in their statistics course. The statistics course, done well, will prepare them to independently write their quantitative dissertation (saving the faculty mentor about 4-5 hours/student). Moreover, in the dissertation process, students use the tool and AutoDrafting to streamline their results chapter draft and to put into their own voice. We’ve published all output with Turn-it-in to dissuade students from just pasting. The process of learning is in their statistics class and the time to accurately and rigorously draft results is in the dissertation process.
Current APA guidelines require that you cite software used as part of a research study. To adhere to these guidelines, please use the following citation when utilizing Intellectus Statistics™ in your research:
Intellectus Statistics. (2026). Intellectus Statistics [Online computer software]. Retrieved from http://statistics.intellectus360.com
No, Intellectus Statistics is a stand-alone platform. You do not need to have access to SPSS, SAS, STATA or any other analysis program to use Intellectus Statistics™.
Yes! Intellectus is web-based so it can be used on any operating system. All you need is an internet connection.
A usability study was published in 2018 comparing Intellectus Statistics and SPSS differences in user performance based on presentation of statistical data. You can read the full study here.
The application will accept data in CSV, Excell, SPSS, SAS, and STATA formats, you can also enter your own data.
When uploading your data file to the application all variables with text data will default to nominal level of measurement and all variables with numeric data will default to scale level of measurement. Level of measurement can be adjusted after upload if desired.
Absolutely yes. The Intellectus Statistics statistical tests (e.g., ANOVA, regression, chi-square, etc.) use the same statistical algorithms (e.g., least squares) and probability distributions (e.g., binominal, chi-squared, F-distribution, Fisher’s Z, Logistic, Normal, Poisson, etc.). Therefore, the significance levels and conclusions drawn are precisely the same and yield identical results.
A 7-day free trial is available to all users. You must enter your credit card information to begin the trial, but you will not be charged until the trial period is over.
If you do not cancel your free trial, it will be converted into a regular subscription after 7-days and you will be billed at the beginning of each billing period. At any point, you may cancel your subscription to avoid being charged for the following billing period.
Once logged-in to the application, click the Profile option located at the top right. Select “Account” and from that screen click the “cancel” option next to the subscription you’d like to cancel.
Yes, we provide one-on-one consulting. You an register for a session within the application by clicking the Consulting Session tab located at the bottom of the left menu.
The maximum upload size is 100MB. The number of rows and columns can vary based on the number of numeric variables and the number of levels within nominal variables.
Intellectus does not support uploading data spread out over multiple tabs in Excel. In order to have all your data upload, you will need to combine it all onto the first tab. There are two ways to do this depending on whether you have matched case data or independent samples.
Matched-case data is when you have data for the same subjects in each group. Each observation will have a “Subject ID” that you could use to match rows across multiple samples. Combining matched-case data involves pasting the columns side-by-side and matching them by ID. Let’s say we have matched-case data for each month on a new tab. We can copy the columns of each tab and match up the “Subject IDs” and paste them in the data on the first tab. The end result will look something like this:
If you have independent samples, where each observation is a different subject, you will need to create a grouping variable instead. Let’s go with the same example above, so we have some measurement by month, where each tab is a different month on independent samples. Putting the data onto one tab will look like this:
To create a Project, first . You can create a new Project by clicking the button at the top of the Projects panel.
The next step is to choose a name for your project. Type the desired name into the text box and click Continue.
Now you must choose a data source. If uploading a file, click the icon corresponding to the correct format, otherwise click the icon to enter data manually. Currently supported file formats include the following:
Make sure your dataset is organized into columns with the variable names at the top. In an Excel or CSV file, your variable names will appear on row 1. If you are entering data manually, the variable names are entered above row 1.
If you don’t have a file, you can upload data by entering the data from scratch in our data editor. The top row of the data editor should contain the variable names and the rows labelled 1,2,3, … should contain the data for the variables. After you are finished entering your data in the spreadsheet, click the Upload button. In order to find out more information about the Data Editor’s sidebar go to the edit data help page.
Intellectus provides scatterplots, bubble plots, histograms, line plots, profile plots, bar plots, pie charts, box plots, and pareto charts. Intellectus also offers a range of control charts, including I, MR, X-bar R, X-bar S, R, S U, C, P and NP Charts. Within many of these control charts are seven rulesets: AIAG, IHI, Montgomery, Nelson-Juran, Joint Commission, Western Electric, and Westgard. Autodrafting technology automatically interprets these rulesets.
Data can be structured in many ways, depending on which analysis is conducted. Intellectus has numerous examples of how to arrange data. Go to Projects tab, select Create Project/ Upload Dataset, then select Choose an Example Dataset. Then select the dataset from Suggested Analysis for the analysis you want to conduct, look at the variables for that analysis, and mirror that data format.
Select Create Project/Upload Dataset
Name your project
Select the type of data that you would like to upload
Upload your dataset from your device.
The application will accept data in CSV, Excell, SPSS, SAS, and STATA formats, you can also enter your own data.
When uploading your data file to the application all variables with text data will default to nominal level of measurement and all variables with numeric data will default to scale level of measurement. Level of measurement can be adjusted after upload if desired.
1. Text embeddings are generated for the open-ended responses using an AI embeddings model.
2. A k-means cluster analysis is conducted on the responses.
3. The k-means model is used to obtain a random sample of open-ended responses from each cluster.
4. A category name is generated for each sample using a generative AI model.
5. The k-means categories are replaced with the new category names and added to the dataset.
It’s also important to emphasize that you should review and validate the category names (and associations with open-ended responses) since an AI model cannot be held responsible for its work.
The maximum upload size is 100MB. The number of rows and columns can vary based on the number of numeric variables and the number of levels within nominal variables.
Intellectus uses blanks for all missing data. If your data set has -999, -1, NA, or other values or symbols to indicate missing data, go to the Management tab, Click Edit data, then Find/Replace. Enter missing data symbol or number in Find/Replace, add a blank space in the Replace, and click “Match entire cell contents,” then click the “Replace All” icon indicated by the red arrow below.
This is likely a level of measurement or number of levels issue. For example, a scale variable for a t-test is coded as ordinal, or you need a nominal variable with two levels and it has three (Male, Men, Female). For either issue, go to Management tab, then click the down-carrot under the variable name, then click select either the correct level of measurement needed or Manage. In Manage, ensure the levels are accurate by Merging or Deleting unnecessary levels.
Here’s the procedure to recode multiple variable(s):
Intellectus does not support uploading data spread out over multiple tabs in Excel. In order to have all your data upload, you will need to combine it all onto the first tab. There are two ways to do this depending on whether you have matched case data or independent samples.
Matched-case data is when you have data for the same subjects in each group. Each observation will have a “Subject ID” that you could use to match rows across multiple samples. Combining matched-case data involves pasting the columns side-by-side and matching them by ID. Let’s say we have matched-case data for each month on a new tab. We can copy the columns of each tab and match up the “Subject IDs” and paste them in the data on the first tab. The end result will look something like this:
If you have independent samples, where each observation is a different subject, you will need to create a grouping variable instead. Let’s go with the same example above, so we have some measurement by month, where each tab is a different month on independent samples.
Data can be structured in many ways, depending on which analysis is conducted. Intellectus has numerous examples of how to arrange data. Go to Projects tab, select Create Project/ Upload Dataset, then select Choose an Example Dataset. Then select the dataset from Suggested Analysis for the analysis you want to conduct, look at the variables for that analysis, and mirror that data format.
Intellectus Statistics has been designed to allow you to perform data management tasks while utilizing the software. After you first upload your data, you can verify the Level of Measurement for each of your variables, and can change the level by selecting the desired option from the appropriate drop down menu and following the subsequent instructions. The Manage Your Data page also allows you to perform further management tasks, including Reverse Coding, Computation of Composite Scores, Removal of Univariate Outliers, Removal of Multivariate Outliers, Transformation, and Multiple Imputation. To learn more about each of these options, simply scroll over the desired task and a pop-up window will provide more information. After you have performed your data management tasks, you have the option to download an updated data set that will reflect any changes you made.
Intellectus Statistics uses two methods of imputation, both described in the book Data Analysis Using Regression and Multilevel/Hierarchical Models by Andrew Gelman and Jennifer Hill. For Nominal and Ordinal variables, the missing values are imputed by randomly sampling from the observed categories. For Scale variables, a type of regression imputation is used. First, the missing values are imputed using the predicted values from the regression (the mean in this case). Last, a random amount is added to each imputed value based on the prediction error.
The data view in Data Tools only shows the first 500 observations. To view and manage the entire data set, click Edit Data option under Data Tools.
Select Create Project/Upload Dataset
Name your project
Select the type of data that you would like to upload
Upload your dataset from your device.
When your data is uploaded to the Intellectus Statistics application you should confirm your levels of measurement are as follows for each analysis:
Pearson Correlation: All variables are scale level of measurement
One way ANOVA: Independent variable is nominal level of measurement; dependent variable is scale
Independent samples t-test: Independent variable is a dichotomous nominal; dependent variable is scale
Dependent samples t-test: both variables are scale
Chi-square: x variable (factor) is nominal; Y variable (factor) is nominal
Linear regression: Dependent variable is scale; predictor(s) scale, ordinal, or nominal
Mediation: Continuous or dichotomous categorical variable
Moderation: Continuous or dichotomous categorical variable
Reliability: All variables should be the same level of measurement with themselves (e.g., only ordinal variables used together)
Logistic regression: Independent variables are nominal or scale; dependent variable is dichotomous
Wilcoxon signed rank: Both variables are ordinal (or scale)
Mann Whitney U: Independent variable is dichotomous; dependent variable is ordinal (or scale)
Kruskal Wallis: Independent variable is nominal with three or more levels; dependent variable is ordinal (or scale)
Friedman Test: All variables are ordinal (or scale)
Repeated measures ANOVA: All variables are scale
One-within One between ANOVA: Independent variable is nominal; dependent variables are scale
ANCOVA: Independent variable is nominal; covariates are scale; dependent variable is scale
Two-Between ANOVA: Dependent variable is scale; independent variables are nominal
Nominal: In this level of measurement, alphanumeric characters or names are used to categorize the data. For example, if gender is your variable, the responses will be male or female.
Ordinal: Ordinal level variables have a meaningful order to them such as rank. For example there is an order to “drink size” (small, medium, large, extra large), however there is not a consistent interval (volume, distance, time, etc.) among categories.
Scale: Numeric variables that have equal intervals between each value, for example age. For example, the amount of time between a 1 year old and 2 year old is the same amount of time as a 51 and 52 year old.
While students are taught four levels of measurement (Nominal, Ordinal, Interval, and Ratio), Intellectus Statistics groups Interval and Ratio data into a single category called Scale. This is a standard practice in statistical software because the mathematical tests used for Interval data (like a personality score) are the same as those used for Ratio data (like weight or height).
Understanding the "Scale" Umbrella
In your classroom, you likely teach the nuances between the four levels:
In Intellectus Statistics:
Intellectus provides scatterplots, bubble plots, histograms, line plots, profile plots, bar plots, pie charts, box plots, and pareto charts. Intellectus also offers a range of control charts, including I, MR, X-bar R, X-bar S, R, S U, C, P and NP Charts. Within many of these control charts are seven rulesets: AIAG, IHI, Montgomery, Nelson-Juran, Joint Commission, Western Electric, and Westgard. Autodrafting technology automatically interprets these rulesets.
Evidence-Based Practice (EBP) is a systematic approach to clinical decision-making that integrates the best available research evidence with clinical expertise and patient values/preferences. It involves five key steps: formulating clinical questions, searching for the best evidence, critically appraising that evidence, integrating it with clinical expertise and patient preferences, and evaluating the outcomes.
Quality Improvement (QI) is a systematic, data-driven approach to enhancing healthcare processes, outcomes, and patient experiences. It focuses on identifying problems, implementing changes, measuring results, and sustaining improvements through continuous cycles of assessment and refinement.
Key Distinctions
EBP primarily focuses on integrating research findings into individual clinical decisions and practice standards.
QI takes a broader systems approach, examining workflows, processes, and organizational structures to drive improvement.
Within Magnet Hospitals
Magnet-designated hospitals have particularly distinctive approaches to both concepts.
Enhanced EBP Integration: Magnet hospitals are required to demonstrate robust EBP programs with dedicated resources and infrastructure. They must show evidence of nurses leading research initiatives and translating findings into practice. There’s an expectation for shared governance structures that empower bedside nurses to implement evidence-based changes.
Elevated QI Expectations: Magnet hospitals must demonstrate superior patient outcomes through systematic QI efforts. They’re required to show sustained improvements over time, not just isolated projects. There’s emphasis on nurse-led QI initiatives and interdisciplinary collaboration.
Synergistic Approach: In Magnet hospitals, EBP and QI are often more integrated than in non-Magnet facilities. Nurses are expected to use evidence-based approaches within their QI projects, and QI data frequently drives new EBP initiatives. This creates a culture where research, practice, and improvement efforts are seamlessly connected, with nurses empowered to lead changes that improve patient outcomes.
Intellectus uses blanks for all missing data. If your data set has -999, -1, NA, or other values or symbols to indicate missing data, go to the Management tab, Click Edit data, then Find/Replace. Enter missing data symbol or number in Find/Replace, add a blank space in the Replace, and click “Match entire cell contents,” then click the “Replace All” icon indicated by the red arrow below.
This is likely a level of measurement or number of levels issue. For example, a scale variable for a t-test is coded as ordinal, or you need a nominal variable with two levels and it has three (Male, Men, Female). For either issue, go to Management tab, then click the down-carrot under the variable name, then click select either the correct level of measurement needed or Manage. In Manage, ensure the levels are accurate by Merging or Deleting unnecessary levels.
The decision tree is designed to help you choose which analysis is best for how you want to analyze your data. To use the decision tree, all you have to do is choose the best option that best answers the question or statement. Continue to answer the questions until an analysis is selected that meets the criteria you provided. As you answer questions, you will see the decision tree being highlighted, so you can see the decisions being made and see its path.
After the decision selects an analysis, you can click the Conduct Analysis link. If you have your project already selected, then the analysis modal will come up for you to provide the inputs and add the analysis to your document in the analysis tab. If there is no project selected, then a dialog will notify you saying that a project must be selected first.
Go to Analyses tab, conduct Descriptives for the variable, then under Output Format, select Raw Output. This is the raw output view that presents quantiles for 10%, 20%, 25%, 30%, 40%, 50%, 60%, 70%, 75%, 80%, and 90% of that variable.
No, Intellectus Statistics is a stand-alone platform. You do not need to have access to SPSS, SAS, STATA or any other analysis program to use Intellectus Statistics™.
Intellectus Statistics uses two methods of imputation, both described in the book Data Analysis Using Regression and Multilevel/Hierarchical Models by Andrew Gelman and Jennifer Hill. For Nominal and Ordinal variables, the missing values are imputed by randomly sampling from the observed categories. For Scale variables, a type of regression imputation is used. First, the missing values are imputed using the predicted values from the regression (the mean in this case). Last, a random amount is added to each imputed value based on the prediction error.
A usability study was published in 2018 comparing Intellectus Statistics and SPSS differences in user performance based on presentation of statistical data. You can read the full study here.
When your data is uploaded to the Intellectus Statistics application you should confirm your levels of measurement are as follows for each analysis:
Pearson Correlation: All variables are scale level of measurement
One way ANOVA: Independent variable is nominal level of measurement; dependent variable is scale
Independent samples t-test: Independent variable is a dichotomous nominal; dependent variable is scale
Dependent samples t-test: both variables are scale
Chi-square: x variable (factor) is nominal; Y variable (factor) is nominal
Linear regression: Dependent variable is scale; predictor(s) scale, ordinal, or nominal
Mediation: Continuous or dichotomous categorical variable
Moderation: Continuous or dichotomous categorical variable
Reliability: All variables should be the same level of measurement with themselves (e.g., only ordinal variables used together)
Logistic regression: Independent variables are nominal or scale; dependent variable is dichotomous
Wilcoxon signed rank: Both variables are ordinal (or scale)
Mann Whitney U: Independent variable is dichotomous; dependent variable is ordinal (or scale)
Kruskal Wallis: Independent variable is nominal with three or more levels; dependent variable is ordinal (or scale)
Friedman Test: All variables are ordinal (or scale)
Repeated measures ANOVA: All variables are scale
One-within One between ANOVA: Independent variable is nominal; dependent variables are scale
ANCOVA: Independent variable is nominal; covariates are scale; dependent variable is scale
Two-Between ANOVA: Dependent variable is scale; independent variables are nominal
Nominal: In this level of measurement, alphanumeric characters or names are used to categorize the data. For example, if gender is your variable, the responses will be male or female.
Ordinal: Ordinal level variables have a meaningful order to them such as rank. For example there is an order to “drink size” (small, medium, large, extra large), however there is not a consistent interval (volume, distance, time, etc.) among categories.
Scale: Numeric variables that have equal intervals between each value, for example age. For example, the amount of time between a 1 year old and 2 year old is the same amount of time as a 51 and 52 year old.
All the answers you need.
Sample Methodology Description:
Qualitative Data Analysis Process
The qualitative analysis of participant responses was conducted using a systematic approach supported by Intellectus Qualitative software. While the software provided computational assistance in the initial stages of data processing, all analytical decisions, interpretations, and final categorizations remained under researcher control and judgment.
Data Processing and Coding: Intellectus Qualitative was employed to support the initial excerpting and coding process by identifying potential patterns and suggesting preliminary codes across the dataset of [X] participant responses. The software’s natural language processing capabilities assisted in detecting recurring themes and concepts within the textual data. However, all suggested codes were manually reviewed, validated, and refined by the researcher to ensure alignment with the research objectives and theoretical framework.
Thematic Development: The software aided in organizing coded segments and identifying potential thematic clusters, providing a systematic foundation for theme development. Intellectus Qualitative’s pattern recognition capabilities helped surface relationships between codes that might have been overlooked in manual analysis alone. Nevertheless, the researcher maintained complete authority over thematic decisions, including the consolidation, separation, or elimination of themes based on theoretical relevance and empirical support.
Quality Assurance: All software-generated suggestions underwent rigorous researcher review. Theme descriptions, category labels, and analytical interpretations were entirely researcher-authored, with the software serving solely as an organizational and pattern-detection tool. The final thematic framework represents the researcher’s analytical judgment informed by, but not determined by, computational assistance.
Rationale for Software Integration: The use of Intellectus Qualitative enhanced analytical rigor by providing systematic pattern detection across large volumes of text while maintaining researcher agency in all interpretive decisions. This hybrid approach combined computational efficiency with human analytical insight, ensuring both thoroughness and theoretical alignment in the qualitative analysis process.
This framing positions you as the expert analyst while acknowledging the software’s supportive role in managing and organizing your data.
Please reference our IRB Compliance document to assist you in filling out IRB forms. You can view the document here.
Intellectus Qualitative (2026) was employed as the software tool for managing and analyzing the qualitative data collected in this study. This software enabled data import and organization, coding and theme development, memoing, data visualization and reporting, and intercoder reliability.
Reference
Intellectus Qualitative [Online computer software]. (2026). Intellectus360. https://qualitative.intellectus360.com
Intellectus Qualitative is a versatile and adaptable coding software compatible with diverse qualitative analysis methods, including Braun & Clarke, Saldana, and Phenomenological coding. It accommodates both deductive and inductive coding approaches, providing a comprehensive platform for researchers to seamlessly integrate their preferred methodologies. Its user-friendly interface and collaborative features facilitate efficient coding processes, allowing researchers to focus on their unique methodological requirements. Whether engaging in systematic thematic analysis, exploring lived experiences, or applying predefined or emergent codes, Intellectus Qualitative empowers users to navigate various coding frameworks with ease. With tools for visualization, collaboration, and automation, Intellectus Qualitative enhances the coding experience, providing a robust solution for qualitative researchers across diverse frameworks and approaches.
Data can be shared on the Projects tab by clicking the 3 dots at the far right of your project. One user at a time is allowed to edit a particular project.
Coding in IQ is intended to be performed on a relatively granular level. Highlight relevant excerpts then add appropriate codes. We do not recommend highlighting large portions of your transcripts.
The AI models and prompts are propriety to Intellectus Qualitative. Users always have the right to accept, modify, or reject any and all AI generated information.
The application will accept data in .docx, .mp4, .txt, .html and .pdf formats, you can also enter your own data.
You can either paste it into a blank transcript or, if you have a short answer or open ended question response in a mostly quantiative surevey, your data may be better suited for the text classification feature in our Intellectus Statistics tool.
Sample Methodology Description:
Qualitative Data Analysis Process
The qualitative analysis of participant responses was conducted using a systematic approach supported by Intellectus Qualitative software. While the software provided computational assistance in the initial stages of data processing, all analytical decisions, interpretations, and final categorizations remained under researcher control and judgment.
Data Processing and Coding: Intellectus Qualitative was employed to support the initial excerpting and coding process by identifying potential patterns and suggesting preliminary codes across the dataset of [X] participant responses. The software’s natural language processing capabilities assisted in detecting recurring themes and concepts within the textual data. However, all suggested codes were manually reviewed, validated, and refined by the researcher to ensure alignment with the research objectives and theoretical framework.
Thematic Development: The software aided in organizing coded segments and identifying potential thematic clusters, providing a systematic foundation for theme development. Intellectus Qualitative’s pattern recognition capabilities helped surface relationships between codes that might have been overlooked in manual analysis alone. Nevertheless, the researcher maintained complete authority over thematic decisions, including the consolidation, separation, or elimination of themes based on theoretical relevance and empirical support.
Quality Assurance: All software-generated suggestions underwent rigorous researcher review. Theme descriptions, category labels, and analytical interpretations were entirely researcher-authored, with the software serving solely as an organizational and pattern-detection tool. The final thematic framework represents the researcher’s analytical judgment informed by, but not determined by, computational assistance.
Rationale for Software Integration: The use of Intellectus Qualitative enhanced analytical rigor by providing systematic pattern detection across large volumes of text while maintaining researcher agency in all interpretive decisions. This hybrid approach combined computational efficiency with human analytical insight, ensuring both thoroughness and theoretical alignment in the qualitative analysis process.
This framing positions you as the expert analyst while acknowledging the software’s supportive role in managing and organizing your data.
Please reference our IRB Compliance document to assist you in filling out IRB forms. You can view the document here.
Intellectus Qualitative (2026) was employed as the software tool for managing and analyzing the qualitative data collected in this study. This software enabled data import and organization, coding and theme development, memoing, data visualization and reporting, and intercoder reliability.
Reference
Intellectus Qualitative [Online computer software]. (2026). Intellectus360. https://qualitative.intellectus360.com
Data can be shared on the Projects tab by clicking the 3 dots at the far right of your project. One user at a time is allowed to edit a particular project.
Coding in IQ is intended to be performed on a relatively granular level. Highlight relevant excerpts then add appropriate codes. We do not recommend highlighting large portions of your transcripts.
The AI models and prompts are propriety to Intellectus Qualitative. Users always have the right to accept, modify, or reject any and all AI generated information.
Sample Methodology Description:
Qualitative Data Analysis Process
The qualitative analysis of participant responses was conducted using a systematic approach supported by Intellectus Qualitative software. While the software provided computational assistance in the initial stages of data processing, all analytical decisions, interpretations, and final categorizations remained under researcher control and judgment.
Data Processing and Coding: Intellectus Qualitative was employed to support the initial excerpting and coding process by identifying potential patterns and suggesting preliminary codes across the dataset of [X] participant responses. The software’s natural language processing capabilities assisted in detecting recurring themes and concepts within the textual data. However, all suggested codes were manually reviewed, validated, and refined by the researcher to ensure alignment with the research objectives and theoretical framework.
Thematic Development: The software aided in organizing coded segments and identifying potential thematic clusters, providing a systematic foundation for theme development. Intellectus Qualitative’s pattern recognition capabilities helped surface relationships between codes that might have been overlooked in manual analysis alone. Nevertheless, the researcher maintained complete authority over thematic decisions, including the consolidation, separation, or elimination of themes based on theoretical relevance and empirical support.
Quality Assurance: All software-generated suggestions underwent rigorous researcher review. Theme descriptions, category labels, and analytical interpretations were entirely researcher-authored, with the software serving solely as an organizational and pattern-detection tool. The final thematic framework represents the researcher’s analytical judgment informed by, but not determined by, computational assistance.
Rationale for Software Integration: The use of Intellectus Qualitative enhanced analytical rigor by providing systematic pattern detection across large volumes of text while maintaining researcher agency in all interpretive decisions. This hybrid approach combined computational efficiency with human analytical insight, ensuring both thoroughness and theoretical alignment in the qualitative analysis process.
This framing positions you as the expert analyst while acknowledging the software’s supportive role in managing and organizing your data.
Intellectus Qualitative is a versatile and adaptable coding software compatible with diverse qualitative analysis methods, including Braun & Clarke, Saldana, and Phenomenological coding. It accommodates both deductive and inductive coding approaches, providing a comprehensive platform for researchers to seamlessly integrate their preferred methodologies. Its user-friendly interface and collaborative features facilitate efficient coding processes, allowing researchers to focus on their unique methodological requirements. Whether engaging in systematic thematic analysis, exploring lived experiences, or applying predefined or emergent codes, Intellectus Qualitative empowers users to navigate various coding frameworks with ease. With tools for visualization, collaboration, and automation, Intellectus Qualitative enhances the coding experience, providing a robust solution for qualitative researchers across diverse frameworks and approaches.
The application will accept data in .docx, .mp4, .txt, .html and .pdf formats, you can also enter your own data.
You can either paste it into a blank transcript or, if you have a short answer or open ended question response in a mostly quantiative surevey, your data may be better suited for the text classification feature in our Intellectus Statistics tool.
Yes, we offer consulting to assist you in analyzing your qualitative data. You can schedule a consultation from this website or directly from withing the application.


